Self-Learning Search Optimization
![]() The ‘Search Phrases’ section has been added to 4me’s Analytics console. When you open it, you will see two graphs on the right side of the screen. The first graph shows the total number of searches that were performed and the percentage of those that resulted in a conversion (a conversion happens whenever a user selects an item from the search results).
The ‘Search Phrases’ section has been added to 4me’s Analytics console. When you open it, you will see two graphs on the right side of the screen. The first graph shows the total number of searches that were performed and the percentage of those that resulted in a conversion (a conversion happens whenever a user selects an item from the search results).
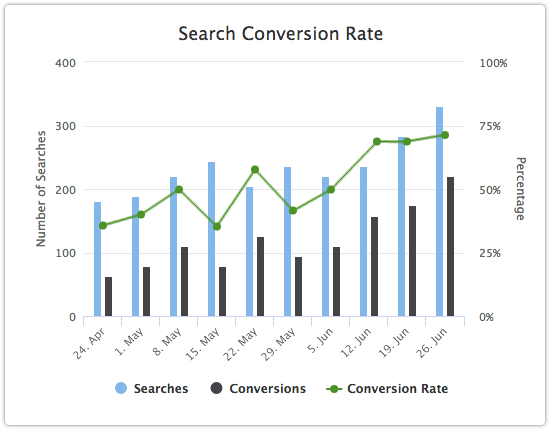
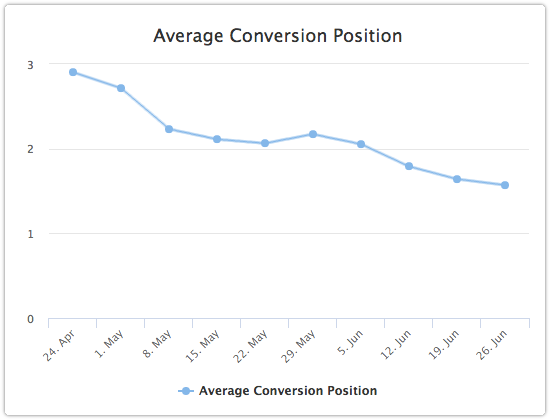
The second graph shows the average position of the selected item in the search results. The record that is presented at the top of the list of search results is at position ‘1’.
The left side of the screen shows the top 100 search phrases. By default the searches that were performed in the Service Desk console are listed. The buttons at the top of this view can be used to switch to the top 100 search phrases used in Self Service (which includes Mobile).

When you select a search phrase from this view, you can see details like its conversion rate, average position in the list of search results, as well as the knowledge articles, request templates and/or services that users selected from the search results.

Being able to review this information allows support organizations to optimize the phrases that they use in their knowledge article, request template and service records.
The best thing about this data, however, is that 4me now uses it to optimize the search results. From this data 4me learns which records get selected for specific search phrases. Over time, these records get positioned higher up in the search results.